Poisson Distribution Football Model: How Predictions Work
How mathematical football predictions work: the Poisson model step by step, from goal averages to match probabilities and fair odds, plus its limits.
The Poisson model in one answer
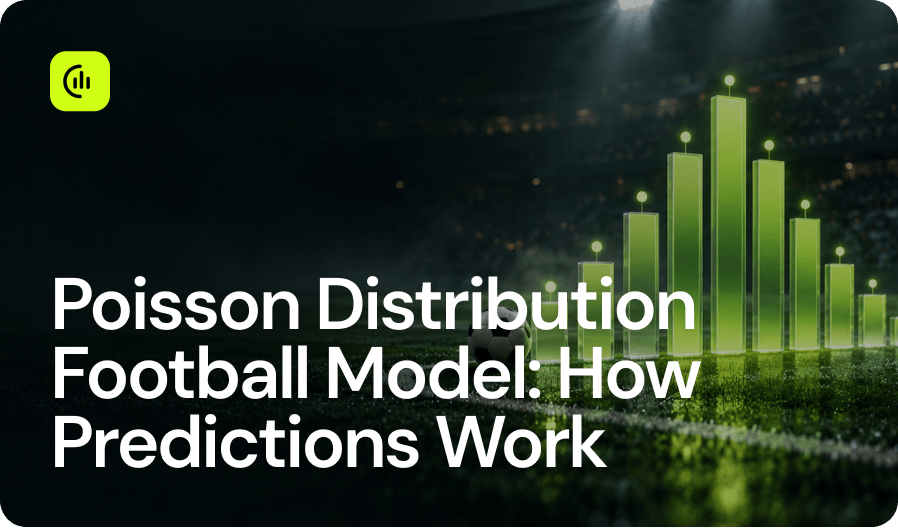
The Poisson distribution is a formula that estimates how likely a team is to score 0, 1, 2, 3 or more goals in a match, based on how many goals it is expected to score on average. Football goals are rare, roughly independent events, which makes them a good fit for Poisson. Combine the goal probabilities of both teams and you get the probability of every scoreline, and from those the chances of a home win, draw, away win, over/under goals and both teams to score.
It is the starting point for most mathematical football predictions, but it is not a complete model on its own. This guide walks through a Poisson calculation step by step, shows how it turns into market probabilities and fair odds, and explains its limitations. It is written for bettors who want to understand the maths behind football predictions rather than rely on gut feeling.
What is the Poisson distribution?
The Poisson distribution describes how often a random event happens in a fixed period when you know its average rate. In football, the event is a goal and the period is one match.
The Poisson distribution formula is:
P(k) = (λ^k × e^−λ) ÷ k!
- k is the given number of goals (0, 1, 2, 3…);
- λ (lambda) is the team's goal expectancy: the average number of goals it is expected to score in this match;
- e is a mathematical constant, about 2.718;
- k! is k factorial, for example 3! = 3 × 2 × 1 = 6.
You do not need to calculate it by hand. A spreadsheet function such as POISSON.DIST does the calculation for you. What matters is getting λ right.
Fußballvorhersagen basierend auf Daten
KI-gestützte Spielanalyse mit Teamform, wichtigen Statistiken und Wertquoten zur Unterstützung intelligenterer Wettentscheidungen.
Vorhersagen prüfen
Step 1: Calculate goal expectancy (λ) for each team
Goal expectancy, the expected number of goals for each side, combines each team's attack strength, the opponent's defence strength and league averages. Here is a worked example with simple numbers for a hypothetical league.
League averages: home teams score 1.50 goals per game, away teams score 1.20.
Home team:
- scores 1.80 goals per home game → attack strength = 1.80 ÷ 1.50 = 1.20;
- concedes 1.08 goals per home game → defence strength = 1.08 ÷ 1.20 = 0.90.
Away team:
- scores 1.08 goals per away game → attack strength = 1.08 ÷ 1.20 = 0.90;
- concedes 1.65 goals per away game → defence strength = 1.65 ÷ 1.50 = 1.10.
The inputs are simply goals scored and goals conceded from past match data, home and away. Now multiply:
- Home goal expectancy: 1.20 (home attack) × 1.10 (away defence) × 1.50 (league home average) = 1.98
- Away goal expectancy: 0.90 (away attack) × 0.90 (home defence) × 1.20 (league away average) = 0.97
In real football you would use a full season of historical data, for example from the Premier League or any other league, rather than a handful of games. A value above 1 for attack strength means the team scores more than the league average; above 1 for defence strength means it concedes more than average. Using home and away numbers separately builds home advantage into the model.
Step 2: Turn goals λ into Poisson probability for each score
Put each λ into the Poisson formula for 0 to 5 goals:
Goals | Home team (λ = 1.98) | Away team (λ = 0.97) |
|---|---|---|
0 | 13.8% | 37.9% |
1 | 27.3% | 36.8% |
2 | 27.1% | 17.8% |
3 | 17.9% | 5.8% |
4 | 8.8% | 1.4% |
5 | 3.5% | 0.3% |
The home team is most likely to score one or two goals; the away team is most likely to score none or one.
Step 3: Build the scoreline probabilities
Because the model treats both teams' goals as independent, the probability of an exact score is simply the two probabilities multiplied. For 1-0: 27.3% × 37.9% ≈ 10.4%.
Home \ Away | 0 | 1 | 2 | 3 |
|---|---|---|---|---|
0 | 5.2% | 5.1% | 2.5% | 0.8% |
1 | 10.4% | 10.1% | 4.9% | 1.6% |
2 | 10.3% | 10.0% | 4.8% | 1.6% |
3 | 6.8% | 6.6% | 3.2% | 1.0% |
The most likely single scores are 1-0, 2-0 and 1-1, each around 10%. Even the most likely correct score happens only about one time in ten, which is why the correct score market is so hard to predict.
Step 4: From scorelines to market probabilities and fair odds
Add up the right cells and you get the probability for each betting market:
Market | Probability | Fair odds |
|---|---|---|
Home win | 60.9% | 1.64 |
Draw | 21.3% | 4.70 |
Away win | 17.9% | 5.60 |
Over 2.5 goals | 56.6% | 1.77 |
Both teams to score | 53.5% | 1.87 |
- Home win probability is the sum of all cells where the home team scores more (1-0, 2-0, 2-1 and so on).
- Draw is the sum of 0-0, 1-1, 2-2 and beyond.
- Over 2.5 goals is the sum of every score with three or more goals.
- Both teams to score is (1 − home 0-goal chance) × (1 − away 0-goal chance).
Fair odds are 1 divided by the probability. If a bookmaker offers 1.75 on the home win, the expected value is 0.609 × 1.75 − 1 ≈ +6.6%. That is how a Poisson model flags possible value bets: by comparing its probabilities with market odds. The difference between the model's likelihood and the betting odds is the potential edge.
Limitations of a pure Poisson model
A pure Poisson model is a useful tool, but real football is messier than the formula.
- It under-predicts draws. Low scores such as 0-0 and 1-1 happen more often in real football than independent Poisson assumes. The Dixon-Coles correction adjusts these scorelines.
- Goals are not fully independent. Game state matters: a team that goes ahead may sit back, and a team that falls behind may attack.
- It ignores team news. Injuries, suspensions and rotation change a team's strength, but the formula only sees historical data.
- Small samples mislead. Early in the current season, a few games can produce extreme attack or defence numbers. Blending in last season's data or league averages helps.
- Recent form and motivation are missing. A team on a strong run, or one with nothing to play for, is not the same as its season average.
- Bookmakers use it too. Market odds already include this kind of model, so a basic Poisson calculation rarely beats the market on its own.
Poisson distribution models describe typical goal totals well, but actual goals in individual matches still vary widely, so no single forecast is accurate every time. Poisson is a strong first estimate, not a finished prediction. Better models adjust it for form, opponent strength, schedule and context.

How SmartBet.gg uses the numbers
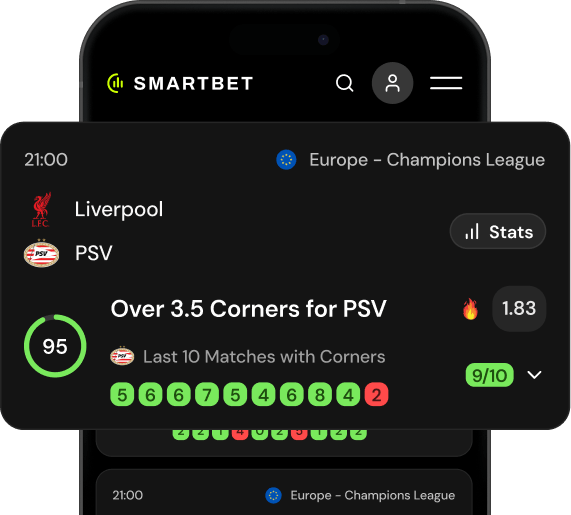
SmartBet.gg is a data-driven football predictions platform. Its predictions combine recent matches, opponent strength, opponent averages and form, and show the resulting probability next to bookmaker odds and expected value for every market. You do not need to build a spreadsheet: the probabilities for 1X2, over/under 2.5 goals, both teams to score and more are already calculated for 120+ leagues.
Results are published openly, including the picks that miss, so you can judge how well the probabilities hold up.
FAQ: Poisson distribution in football
Can you explain the Poisson distribution in a simple way? It tells you how likely it is that something happens 0, 1, 2 or more times when you know how often it happens on average. In football, it turns a team's goal expectancy into the chance of each number of goals.
How do you calculate goal expectancy for Poisson? Multiply the team's attack strength, the opponent's defence strength and the league average goals for home or away teams.
Can Poisson predict the exact score? It gives a probability for every score, but even the most likely score usually has only around a 10% chance. It is better for markets like 1X2 and over/under than for correct score.
Why does Poisson under-predict draws? Because it treats both teams' goals as independent. In real matches, low-scoring draws happen more often than that assumption suggests. The Dixon-Coles correction is the most common fix.
Do mathematical football predictions guarantee wins? No. A model estimates probabilities more accurately than guesswork, but a 60% outcome still fails four times in ten. Use the numbers as a guide to value, not a promise.
See the probabilities for today's matches
See today's football predictions on SmartBet.gg with probabilities, odds and expected value for every match: 2 free picks daily, and Premium unlocks every match and market.
Treat betting as entertainment, stake only what you can afford to lose and use stats as a guide, not a promise.

Verwandte Beiträge