Soccer Betting Data Guide: How to Analyse a Match
Learn how to use soccer betting data, xG, team form and odds to analyse a match. A practical workflow with a probability example and pre-bet checklist.

The same football match can produce hundreds of statistics and dozens of confident predictions. Useful soccer betting data helps answer a narrower question: does the available price make sense given the evidence? A team may be likely to win but still be too short in the market. An outsider may be unlikely to win but fairly priced at longer odds.
This guide takes you from the bookmaker's price to a documented decision. It covers the statistics worth checking, the match context that numbers miss, and a worked example of comparing your estimate with the odds. No statistic or model can remove the uncertainty of a single match.
1. Turn the odds into a probability
Start with one clearly defined market, such as a home win in 1X2 or Over 2.5 goals. With decimal odds, divide 1 by the price to find its implied probability. Odds of 2.00 imply 50%; odds of 1.50 imply about 66.7%. The calculation gives you a threshold to compare with your own estimate.
These raw probabilities include the bookmaker's margin. In a 1X2 market, the implied probabilities of a home win, draw and away win will usually add up to more than 100%. If you want to understand the margin and how to read market expectations, see the guide to odds and implied probability.
Write down the current price before studying the teams. This makes it harder to decide that a favourite is a good bet merely because it is a good team. The research task is to assess whether the available odds compensate for the chance that your selection loses.
2. Select data that fits the market
Different bets call for different evidence. A team can create plenty of chances but still offer little value on the 1X2 market if its win price is already low. Start with a small set of measures relevant to the selection you are considering.
Data | What it helps you assess | What to check before using it |
|---|---|---|
xG and xGA | Chance quality created and allowed | Model differences, penalties and opponent quality |
Shot quality and volume | Whether attacking output is repeatable | Game state and shots from poor locations |
Home and away splits | How a team performs at the relevant venue | Small samples and the strength of past opponents |
Recent results and underlying play | Whether a run of wins or losses reflects performance | Red cards, late goals and changes in the lineup |
Team news and rest | Whether the historical baseline still applies | Replacement quality, rotation and the timing of the news |
Expected goals (xG) estimates the quality of scoring chances; expected goals against (xGA) does the same for chances conceded. If a side scores 14 goals from 8.5 xG, its finishing has outpaced its chance creation in that sample. That is a prompt to investigate, not a rule that it must score less next week. Our expected goals betting guide explains how to read xG without treating it as a pick generator.
For a goals market, both teams' chance creation, chance prevention and playing styles may be especially relevant. For a match result, overall team strength, venue, likely starting elevens and tactical matchup deserve more weight. Keep the evidence tied to the specific outcome you are pricing.
3. Check sample size and opponent strength
A three-match winning streak is a result, not an explanation. It may reflect sustained improvement, or it may include a penalty, a late deflection and opponents who created better chances. Look at season-long performance for a stable baseline, then compare it with recent games to identify genuine changes.
If the recent numbers differ sharply, ask why. A new manager, a returning midfielder or a change from a back four to a back three can make older data less representative. Conversely, five matches against weak attacks can flatter a defence without showing any real improvement. The team form analysis guide goes deeper into separating repeatable signals from short-term noise.
Home and away splits also need context. A poor away record against the league's strongest clubs should not be treated like a poor away record against average opposition. Prefer a coherent explanation of the split to a headline percentage taken from a handful of fixtures.
Football Predictions Based on Data
AI-driven match analysis using team form, key statistics and value bets to support smarter betting decisions.
Check predictions
4. Adjust for the match in front of you
Historical statistics describe past teams in past circumstances. Before using them for the next fixture, check the likely lineup, injuries, suspensions, rest and travel. The role of an absent player matters more than name recognition. Losing a defensive midfielder who protects transitions may change the match differently from losing a striker with a capable replacement.
Look for tactical interaction as well. A possession-heavy favourite might dominate a deep defence but struggle when pressed high. An underdog that thrives on counterattacks may create better chances against an aggressive opponent than against a cautious one. Weather and scheduling can matter, but only when you can explain how they alter the relevant market.
Revisit your estimate when lineups are confirmed. If the price moves after new information, compare your updated assessment with the new odds. A good idea at yesterday's price is not automatically a good bet today.
5. Compare your estimate with the offered price
Imagine a hypothetical home win offered at 2.10. The break-even probability at those odds is 1 ÷ 2.10, or about 47.6%. Suppose your evidence supports a 51% chance. Your estimated fair odds are 1 ÷ 0.51, or about 1.96. The estimated expected value per unit staked is (0.51 × 2.10) − 1 = 0.071, or 7.1%.
That figure is only as good as your probability estimate. If a reasonable range is 46% to 53% because the lineup is uncertain, the range crosses the break-even point. Passing may be more sensible than treating the 51% midpoint as precise. The value betting guide covers this price-versus-probability comparison in more detail.
Avoid counting the same signal twice. A team's weak results, poor league position and negative headlines may all come from one injury crisis. Giving each a separate large adjustment can distort your estimate. Explain what changed, how much it plausibly matters, and whether the market already knows it.
6. Record the decision and check it later
For each selection, note the market, odds taken, estimated probability or range, stake, main reasons and the information available at the time. After the match, add the result and the closing price. This helps you distinguish a well-reasoned losing bet from a lucky winning one.
Closing odds are useful context, not a verdict. Consistently taking prices that later shorten can be an encouraging sign, but one movement may reflect news you did not have or a thin market. Review groups of decisions rather than drawing conclusions from a few results.
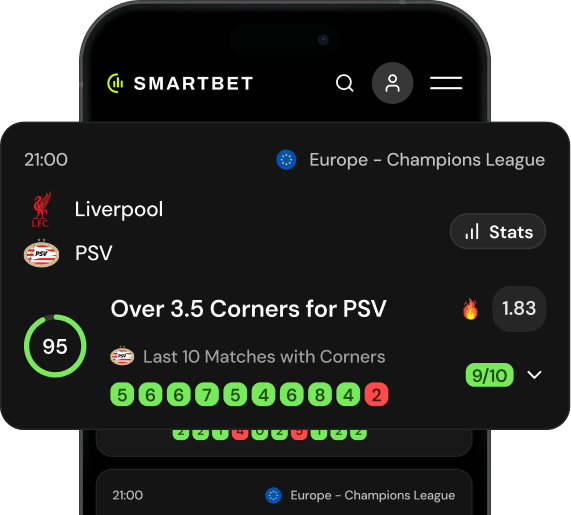
SmartBet can help organise fixture statistics, model signals and price comparisons. You can explore its football value bets and filters as a starting point for further research. Treat any flagged selection as something to evaluate, not as an instruction to bet.
Football Predictions Based on Data
AI-driven match analysis using team form, key statistics and value bets to support smarter betting decisions.
Check predictionsPre-bet soccer data checklist
- Define the exact market and record the available odds.
- Calculate the break-even probability and note the bookmaker's margin.
- Compare season data with recent performance and the quality of opponents.
- Check xG, chance quality and the indicators that fit this particular market.
- Review likely lineups, rest and the tactical matchup.
- Estimate a probability range, then compare it with the current price.
- Record your reasoning and pass if the apparent edge depends on a fragile assumption.
Frequently asked questions
Which soccer betting data matters most?
It depends on the market. For a match winner, start with team strength, chance quality, venue and availability. For a goals market, look closely at both sides' chance creation, chance prevention and styles. Always compare those inputs with the odds.
Is xG enough to predict a football match?
No. xG describes the quality of chances in past matches. It does not fully capture future lineups, tactical changes, finishing skill or how a specific matchup will unfold. It is one input in a wider estimate.
What if my estimated probability is close to the market's?
Small gaps can disappear when you account for model error, late team news or a change in price. If you cannot explain a robust edge, leaving the match alone is a valid outcome.

Related Posts