How a Match Analysis Dashboard Improves Betting
A match analysis dashboard organizes football data, probabilities, and market context so bettors can evaluate fixtures with discipline before betting.

A late injury update, a popular team on a winning streak, and an attractive price can create a convincing betting story in seconds. A match analysis dashboard is designed to slow that process down. It puts the relevant football data, probability estimates, team context, and market information in one place so a bettor can assess the fixture before reacting to a headline or a hunch.
The purpose is not to produce certainty. Football remains a low-scoring sport with volatile outcomes, and even a well-supported position can lose. The value of a dashboard is more practical: it gives users a repeatable method for deciding whether the available odds appear to reflect the likely match scenario.
What a Match Analysis Dashboard Should Do
A useful dashboard turns scattered information into a structured pre-match view. Instead of moving between league tables, injury reports, recent scores, and odds screens, the bettor can start with a single analytical frame.
That frame should answer a few basic questions. How strong have the teams been beyond their latest results? What is changing for this specific fixture? What outcome probabilities does the model assign? And does the betting market leave enough room between its implied probability and the estimated probability to justify attention?
The distinction between information and interpretation matters. A table showing that a team has won four consecutive matches is information. A dashboard that also shows the quality of those opponents, chance creation, defensive concessions, home and away splits, and lineup changes provides the context needed to interpret that run.
A good tool does not simply make data look cleaner. It helps prevent a bettor from overweighting the loudest stat.
Start With Team Strength, Not the League Table
League position is a useful reference, but it is often an incomplete measure of current ability. Teams can accumulate points through favorable schedules, late goals, penalties, or short-term finishing variance. Conversely, a team may sit lower than expected after creating better chances than its results suggest.
A match analysis dashboard should therefore place results alongside performance indicators. Expected goals and other football statistics can help estimate the quality of chances created and conceded. Shot volume, shots allowed, big chances, possession patterns, and set-piece performance can add useful detail, depending on the league and data coverage.
No individual metric settles the question. Expected goals, for example, are helpful because they look beyond whether a shot became a goal, but they do not capture every tactical factor, goalkeeper action, or player-specific finishing quality. The right approach is to use several indicators to form a more realistic view of a team’s baseline.
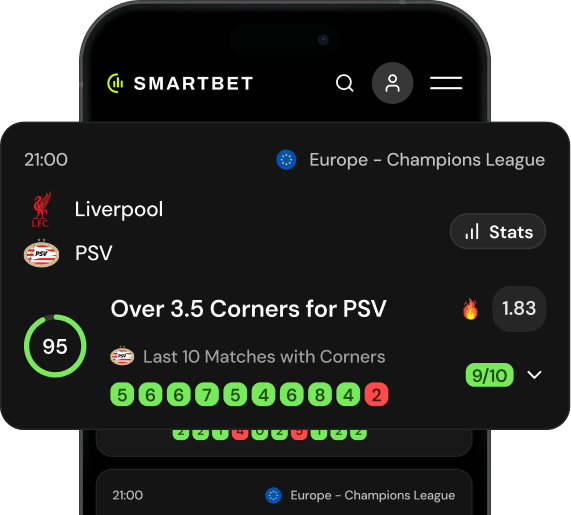
Previsioni Calcio Basate su Dati
Analisi delle partite guidata dall'IA utilizzando la forma della squadra, statistiche chiave e scommesse di valore per supportare decisioni di scommessa più intelligenti.
Visualizza previsioni
Recent Form Needs a Quality Check
Recent form matters, particularly when it reflects tactical changes, returning players, or a clear change in performance level. But five-match records are easy to misread.
A 4-1-0 record may look dominant until the dashboard reveals that the four wins came against weaker opponents, with narrow expected-goal margins. A 1-2-2 stretch may look poor until you see a difficult schedule and competitive underlying performances against strong sides.
Use recent matches as evidence, not as a verdict. Compare the short-term sample with a longer period, then ask whether there is a credible reason the team should now be rated differently. A new manager, a formation change, or the absence of a key defender may warrant that adjustment. A few unusual scorelines may not.
Add the Context the Numbers Cannot Supply Alone
Football data becomes more useful when it is attached to the conditions of the fixture. Pre-match context can materially change a team’s likely performance, even if season-level data still describes its general quality.
Lineup availability is one of the clearest examples. Losing a leading scorer matters, but so can the absence of a defensive midfielder who protects a vulnerable back line or a fullback whose role drives chance creation. The market may react quickly to high-profile injuries while giving less attention to structural absences that affect how a team plays.
Schedule is another consideration. A side returning from travel, playing its third match in a short period, or prioritizing a midweek knockout match may rotate. This does not automatically make the opponent a bet. It does mean historical team metrics may need to be adjusted for who is likely to play and how motivated each side is to manage the game.
Home and away performance also deserves scrutiny. Some teams maintain their approach in either setting. Others press aggressively at home but sit deeper away, producing a different match profile. The dashboard should make these splits visible without encouraging blind reliance on them. Small samples can exaggerate differences, especially early in a season.
Read Probabilities Before Looking for Picks
Probability modeling is where a dashboard becomes more than a statistics page. Rather than beginning with a preferred side, start with the estimated chances for the main outcomes: home win, draw, away win, and, where relevant, totals or both-teams-to-score markets.
If a model estimates a home win at 48%, that is not a prediction that the home team will win. It means that across a large number of comparable scenarios, the model would expect that result roughly 48 times out of 100. The other outcomes remain very much live.
This framing helps counter a common betting mistake: treating likely as certain. A team can be the most likely winner and still be a poor betting option if the odds are too short. A draw can be less likely than a home win but still represent the more interesting market if its price is materially higher than the probability suggests.
Compare Model Probability With Market Probability
Decimal odds can be converted into a simple implied probability by dividing 1 by the odds. Odds of 2.00 imply 50% before accounting for the bookmaker’s margin. Odds of 2.50 imply 40%.
Suppose a dashboard estimates a team’s win probability at 45%, while the available odds imply approximately 39%. That gap may indicate potential value. It is not proof that the wager will win, and it should not be treated as a signal to bet automatically. The estimated edge must be large enough to account for model uncertainty, market margin, late team news, and the possibility that the market has information the model does not fully capture.
The opposite is equally useful. If your preferred team is priced as though it has a 60% chance but the analytical estimate is closer to 52%, the disciplined decision may be to pass. Skipping a match is part of a sound process, not a missed opportunity.
Use the Dashboard as a Decision Process
The strongest use of a dashboard is consistent, not reactive. Start by checking the market and identifying fixtures where the initial price appears worth investigating. Then review team strength, recent underlying performance, projected lineups, schedule conditions, and match-specific factors. Only after that should you compare the probability estimate with the available odds.
Keep a record of the reasoning behind any position in a consistent bet tracker. Note the market, the price, the estimated probability, the key assumptions, and whether late news altered the view. Over time, this record can reveal whether your process is finding genuine pricing differences or simply confirming existing preferences.
It is also sensible to define a threshold for action. A marginal difference between model and market may not be enough, particularly in efficient major-league markets. The threshold can vary by market type and confidence in the available data, but it should be decided before emotion enters the decision.
A dashboard cannot remove risk, and AI-assisted football analysis should be treated as research support rather than instructions. Models can be wrong because football is unpredictable, data can be incomplete, and conditions change quickly. Their practical advantage is consistency: they apply the same framework when a favorite is popular, when a losing streak feels alarming, and when a social-media narrative sounds persuasive.
Previsioni Calcio Basate su Dati
Analisi delle partite guidata dall'IA utilizzando la forma della squadra, statistiche chiave e scommesse di valore per supportare decisioni di scommessa più intelligenti.
Visualizza previsioniAvoid the Most Common Dashboard Mistakes
More data does not automatically lead to better decisions. One mistake is searching until a metric supports a bet you already want to place. Another is treating a model probability as more precise than it really is. A 53% estimate is not fundamentally different from 52% when lineup uncertainty or a limited sample could move the true number.
It is also easy to overreact to color-coded ratings, trend arrows, and simple labels. These features can prioritize research, but they should not replace the underlying explanation. If a team is rated highly, identify why: Is it chance creation, defensive stability, opponent weakness, lineup news, or a combination of factors?
Finally, avoid forcing every fixture into a market. Some matches have conflicting signals, thin data, or odds that already appear efficient. A dashboard is valuable precisely because it makes those situations easier to recognize.
The most useful habit is simple: let the dashboard challenge your first opinion before money is committed. That pause will not guarantee an outcome, but it can make every betting decision more accountable, more evidence-based, and easier to evaluate over time.

Articoli Correlati