How Football Probability Models Find Value
Football probability models turn team data into realistic match estimates, helping bettors compare projected chances with market odds and assess value.
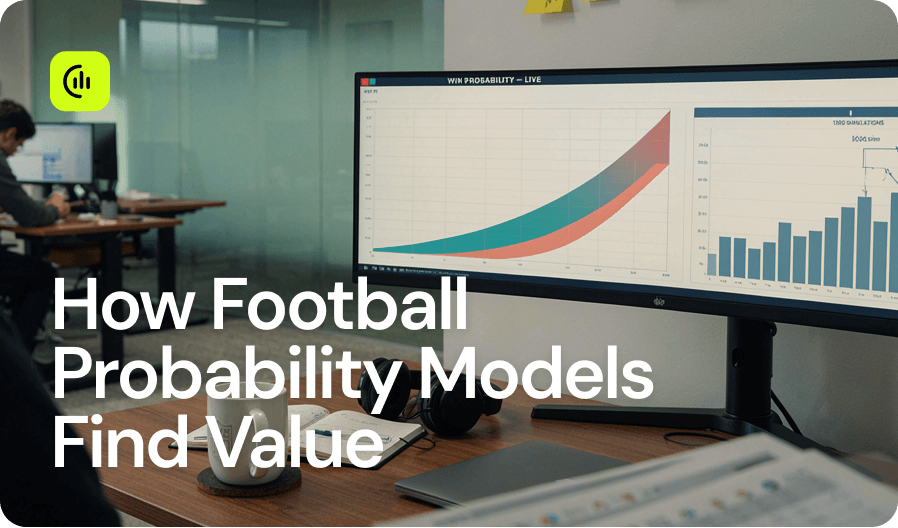
A 1-1 draw is not a prediction failure simply because a model gave the home team a 46% chance to win. Football probability models are built to describe uncertainty, not erase it. Their value is in consistently estimating the chances of each realistic outcome, then showing whether the market price appears to leave room for value.
For bettors, that distinction matters. A confident tip can sound useful, but confidence without a measurable probability offers little basis for judging risk. A model-based process starts somewhere more practical: What does the available evidence suggest, what probability does that imply, and is the offered price better or worse than that estimate?
What football probability models actually do
A football probability model converts relevant match information into estimated outcome probabilities. Depending on its design, it may project a home win, draw, and away win; expected goals; both teams to score; total goals; clean-sheet likelihood; or a range of correct-score probabilities.
The model is not trying to state what will happen with certainty. It is assigning numerical likelihoods across possible outcomes. If Team A is estimated to win 55% of the time, that still leaves a 45% combined chance of a draw or Team B victory. One match cannot prove whether the estimate was good. Quality is measured over a large set of comparable forecasts.
This is where probability provides a more disciplined language than predictions. A bettor can compare a 55% estimated win probability with decimal odds of 2.05, which imply roughly a 48.8% chance before accounting for bookmaker margin. The question is not whether Team A is guaranteed to win. It is whether the market may be pricing its chance below a well-supported estimate.
The data behind a useful probability estimate
The most credible models combine long-term team strength with current match context. Historical results matter, but raw wins and losses are only part of the picture. A team can collect points through a favorable schedule, late goals, or unusually strong finishing. Another can create better chances than its results suggest.
Expected goals data is therefore often central to modern football analysis. It helps separate chance quality from final scorelines by estimating how likely individual shots were to become goals. Over time, expected goals for and against can provide a more stable view of attacking output and defensive exposure than a short run of results alone.
Context changes the estimate as well. Home advantage, injuries, suspensions, fixture congestion, travel, rest days, likely lineups, tactical matchups, and competition incentives can all affect a game. A model that treats every fixture as identical will miss meaningful information. But adding context is not automatically an improvement. Data must be reliable, relevant, and weighted carefully rather than added because it sounds persuasive.
For example, a striker's absence may materially change a team's attack if there is no comparable replacement. By contrast, a vague narrative about momentum may add little once recent performance, opponent quality, and home-field effects are already captured in the data.
Prédictions Footballistiques Basées sur les Données
Analyses de matchs basées sur l'IA utilisant la forme de l'équipe, les statistiques clés et les paris à valeur pour soutenir les décisions de paris plus intelligentes.
Consultez les prédictions
From expected goals to match outcomes
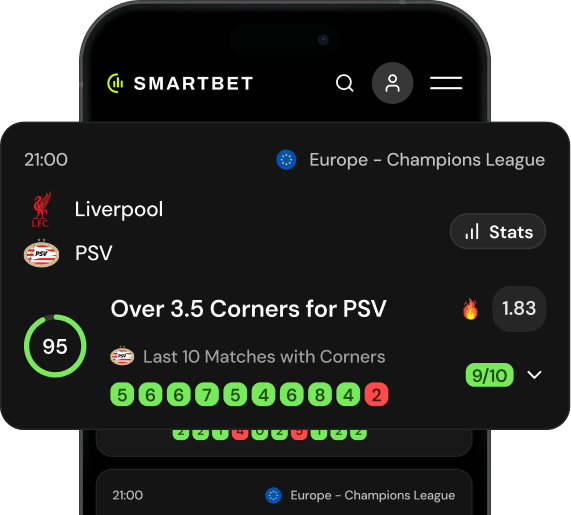
Many goal-based models begin by estimating how many goals each side is expected to score. A common approach uses a statistical distribution to calculate the probability of each scoreline, such as 0-0, 1-0, 1-1, and 2-1. Those scoreline probabilities can then be grouped into market outcomes: home win, draw, away win, over or under totals, and both teams to score.
This method is useful because football scores are low and individual goals have an outsized effect. It also creates a logical bridge between team attacking and defensive indicators and the markets bettors actually evaluate.
Still, no single framework captures football perfectly. Basic goal models can understate correlations between teams, struggle with red cards and game-state effects, or react too slowly to a major lineup change. More sophisticated models may account for these issues, but complexity has a cost. A model that is harder to interpret or maintain is not necessarily more accurate.
Why calibration matters more than a dramatic hit rate
A model can look impressive by correctly identifying many favorites, yet still produce poor betting decisions. If it calls a series of teams 80% likely to win and those teams win only 68% of the time over a meaningful sample, its probabilities are too aggressive. That is a calibration problem.
Calibration asks whether events assigned similar probabilities occur at roughly the expected frequency. Across enough matches, selections given a 60% chance should win close to 60% of the time. This does not mean every group will land exactly on target in a small sample. Variance is unavoidable. It does mean that probabilities should be tested against outcomes rather than accepted because they fit a familiar story.
Accuracy also needs context. A model can be well calibrated and still offer no useful edge if the market has already priced the same information efficiently. For betting research, the relevant question is not just whether a forecast is reasonable. It is whether the forecast differs from the available odds by enough to justify the uncertainty and potentially reveal a value bet.
Turning probability into a value decision
Odds are probabilities expressed as prices. Decimal odds of 2.00 imply a 50% break-even probability. Odds of 1.50 imply 66.7%. The calculation is simple: divide one by the decimal odds.
Suppose a model estimates an away team has a 44% chance of winning and the available price is 2.50. The odds imply a 40% chance. That gap may indicate positive expected value, but it is not an automatic bet. The difference could be too small to overcome model error, timing issues, or information the model has not captured.
A responsible process considers the size and reliability of the edge. It also checks whether the odds are current, whether expected lineups have changed, and whether the market movement reflects meaningful news. A probability estimate is an input to judgment, not a substitute for it.
This is also why bettors should avoid treating every model signal equally. A small edge in a volatile player-prop or correct-score market is different from a larger, well-supported edge in a liquid match-result market. Market depth, limits, and available price all affect what an apparent advantage is worth in practice.
Prédictions Footballistiques Basées sur les Données
Analyses de matchs basées sur l'IA utilisant la forme de l'équipe, les statistiques clés et les paris à valeur pour soutenir les décisions de paris plus intelligentes.
Consultez les prédictionsCommon mistakes when using football probability models
The first mistake is reading a probability as certainty. A 70% favorite will lose often enough that a losing wager is entirely consistent with a sound estimate. Chasing losses because an outcome was “supposed” to happen turns a probability-based process back into emotional betting.
The second is overreacting to recent form. Five matches can contain useful signals, especially after a coaching change or injury crisis, but small samples are noisy. Strong analysis balances recent evidence with longer-term performance and opponent strength.
The third is comparing a model output with the wrong market. A projected 52% home-win chance should be evaluated against the actual home-win odds available, not against a headline prediction, a social-media consensus, or the team’s league position.
Finally, bettors can overtrust the appearance of precision. A figure such as 47.3% may be useful for calculation, but it does not mean the model knows the match to a tenth of a percent. The number represents an estimate shaped by data quality, assumptions, and uncertainty.
A better way to use model outputs
Use football probability models as a structured research layer. Start with the model's estimated probabilities and underlying indicators. Then review the match conditions most likely to make the forecast stale or incomplete, particularly confirmed lineups, absences, schedule pressure, and motivation near the end of a competition.
Next, convert the available odds into implied probability and compare the two numbers. If there is no meaningful gap, passing is a rational outcome. Betting volume is not a measure of quality. The strongest discipline is often recognizing when the market already reflects the available evidence.
SmartBet.gg can make this process faster by bringing team data, match context, and probability-oriented analysis into one research workflow. The decision still belongs to the user, and the uncertainty remains real.
The practical goal is not to find a model that never loses. It is to build a repeatable habit of questioning prices, respecting variance, and making fewer decisions based on loyalty, headlines, or false certainty.

Articles Associés